XXX Congreso Boliviano de Oftalmología
The Intersection of Artificial Intelligence and Ophthalmology
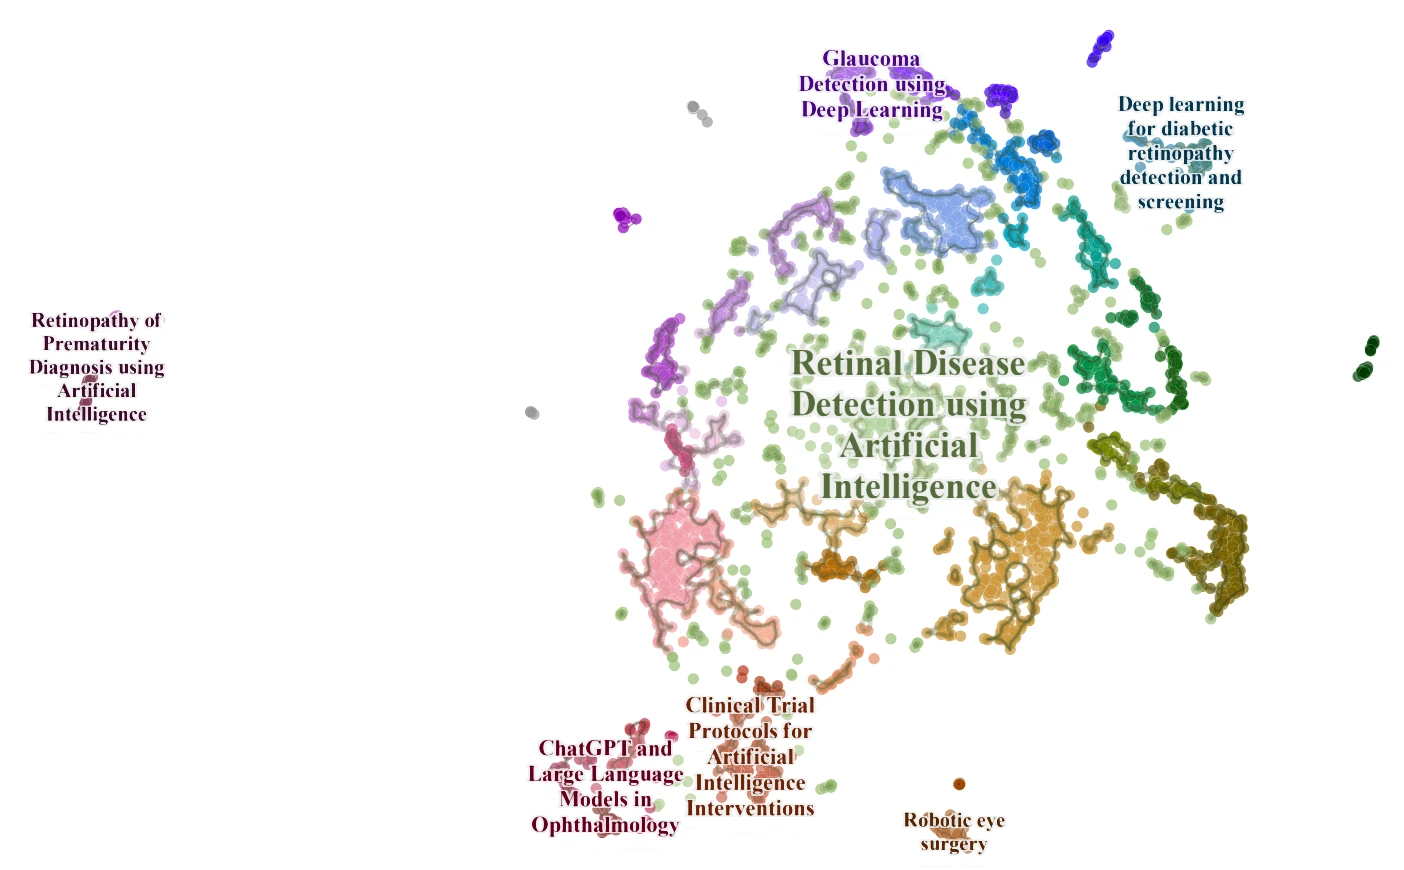
I was invited to give a presentation at the XXX Congreso Boliviano de Oftalmología in Cochabamba, Bolivia. There I presented an exploration of the intersection of artificial intelligence and ophthalmology through an extensive bibliometric analysis. Using data from over 3,400 research papers, I employed state-of-the-art data science techniques, including UMAP dimensionality reduction, BERTopic topic modelling, and HDBSCAN clustering, to visualise the global research landscape. The interactive visualisations I shared allowed attendees to intuitively explore the dominant topics emerging in ophthalmic AI research, from diabetic retinopathy screening to OCT image segmentation, while also highlighting geographical distributions of research activity.
These visualisations served a dual purpose: they not only presented complex data in an accessible format but also empowered clinicians to understand where the field is heading and identify gaps or opportunities for their own practice. By combining large language models with data mapping tools such as DataMapPlot, I was able to narrate the AI research space as a dynamic, evolving ecosystem, effectively translating abstract data into concrete clinical insights. This approach fostered engagement and sparked discussions on how AI technologies can be responsibly and effectively integrated into ophthalmic care to improve health outcomes in Latin America and beyond.

PhD Physics, University College London, United Kingdom
Studies of the Martian upper atmosphere with the UCL Mars thermosphere and ionosphere general circulation model
During my Ph.D. in Physics at University College London, I designed and developed a three-dimensional computer simulation of the Martian upper atmosphere, building it entirely from first principles. This involved deeply researching atmospheric physics, chemistry, radiative transfer, and fluid dynamics, translating these complex equations into stable computational algorithms coded in Python and Fortran. The simulation required iterative derivation, parameterisation, and debugging to ensure physically consistent outputs, which I then validated against NASA and ESA spacecraft data. The technical rigour and independent innovation of this work led to international collaborations and publications in leading journals, establishing the credibility and originality of my scientific contributions.
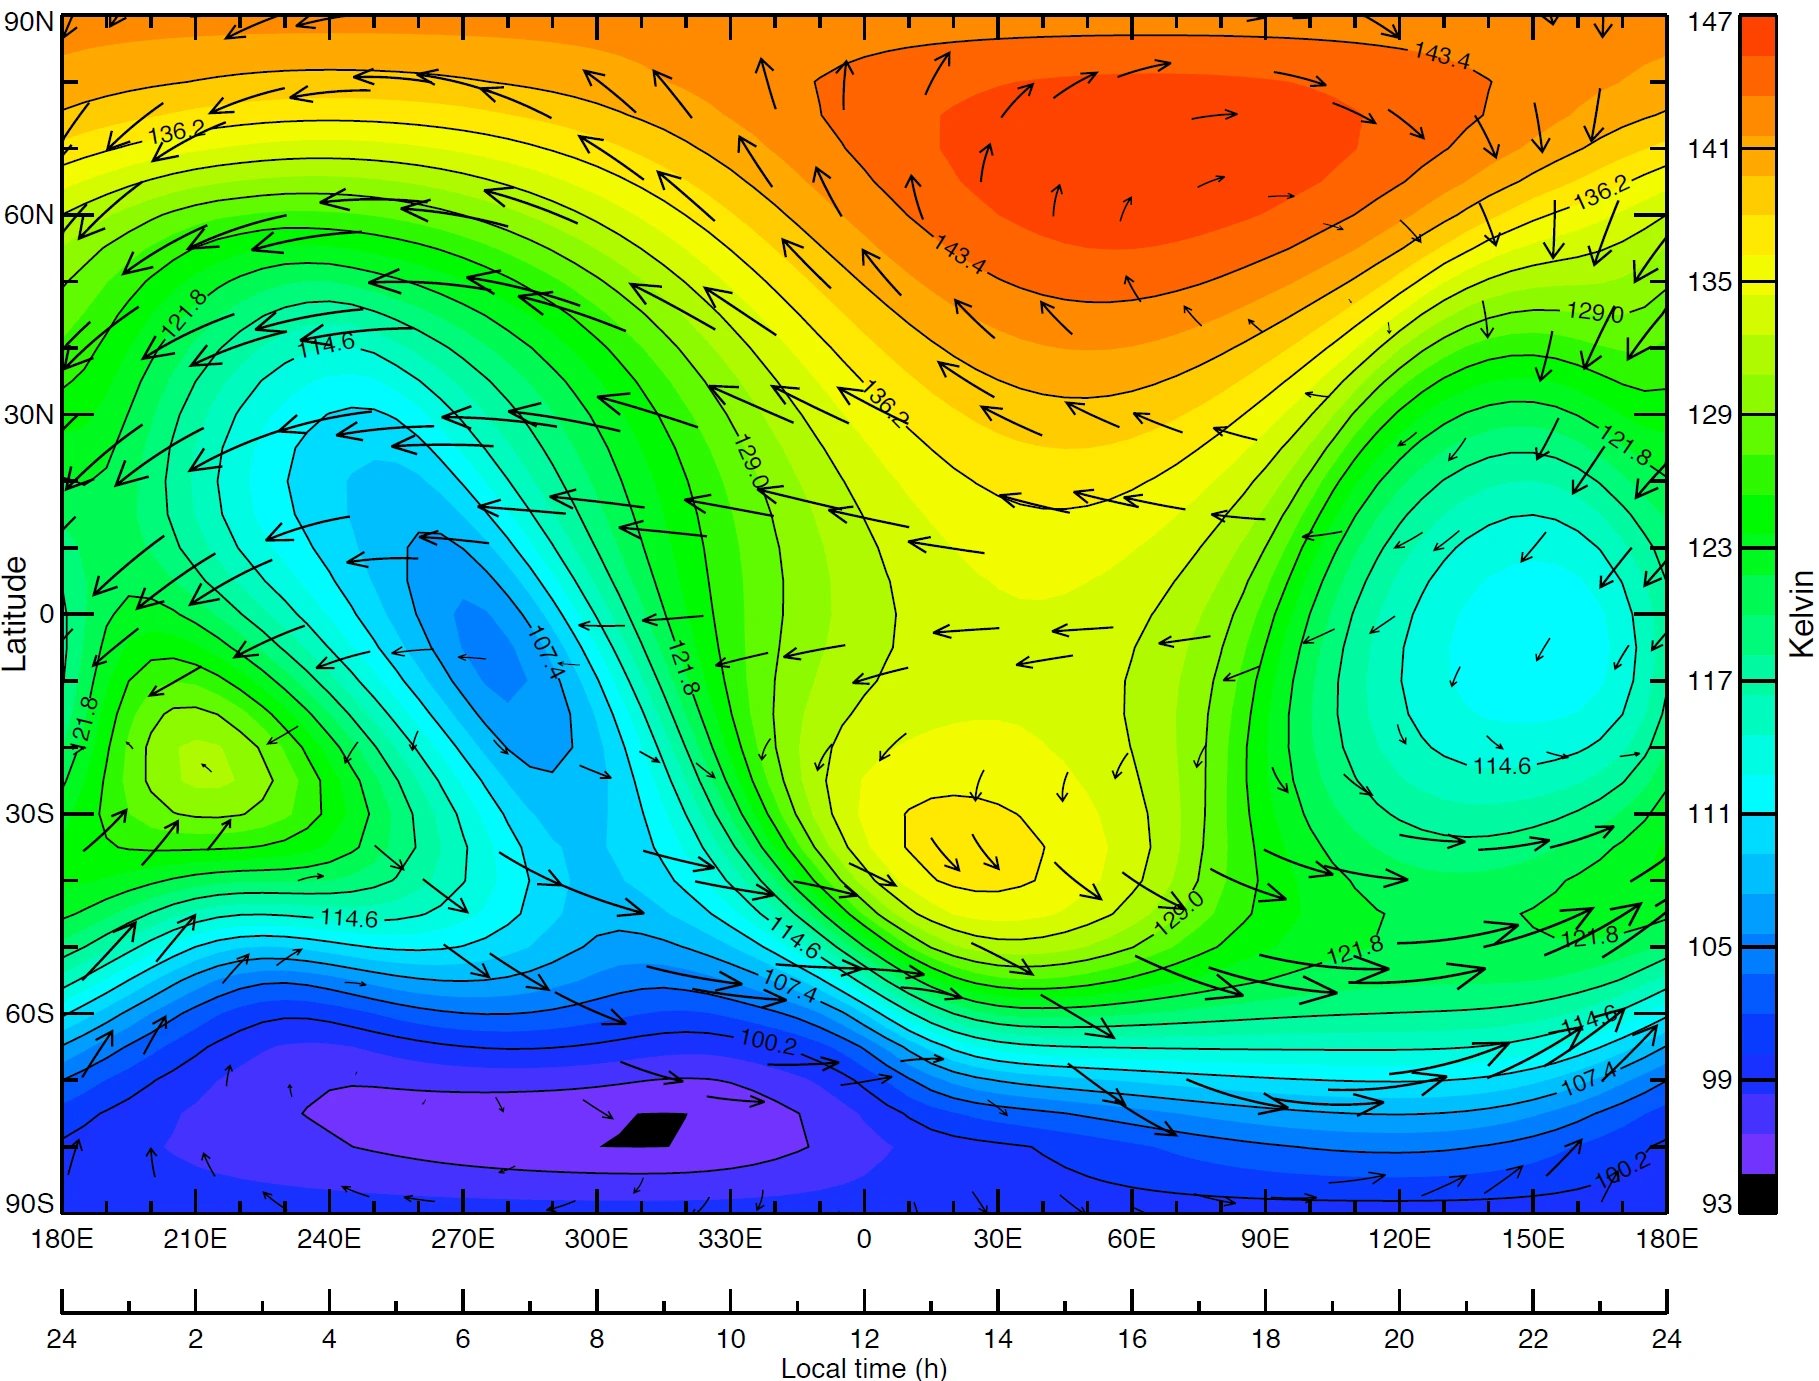
A core part of this endeavour was data visualisation. I transformed vast multi-dimensional outputs into intuitive visual representations analogous to TV weather reports, using colour maps for temperature and vector arrows for winds to tell meaningful scientific stories. These visualisations were not merely illustrative; they were essential analytical tools for verifying model integrity and communicating findings to diverse audiences. Whether presenting to planetary scientists at international conferences or explaining the beauty of atmospheric physics to non-specialist friends and family, I learned that effective visual storytelling bridges the gap between complexity and understanding, fostering shared insight and curiosity. This principle, that technical expertise only achieves impact when made accessible through clear, thoughtful visual communication, remains central to how I lead data science and AI teams today.